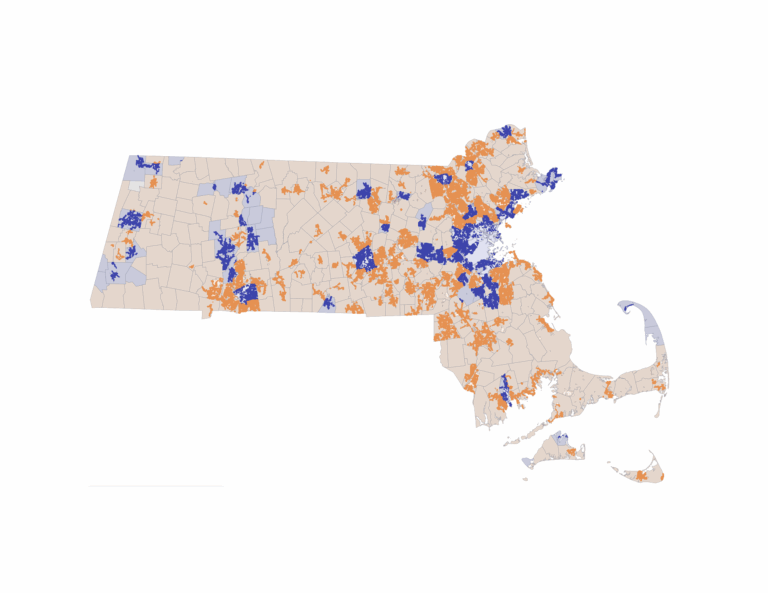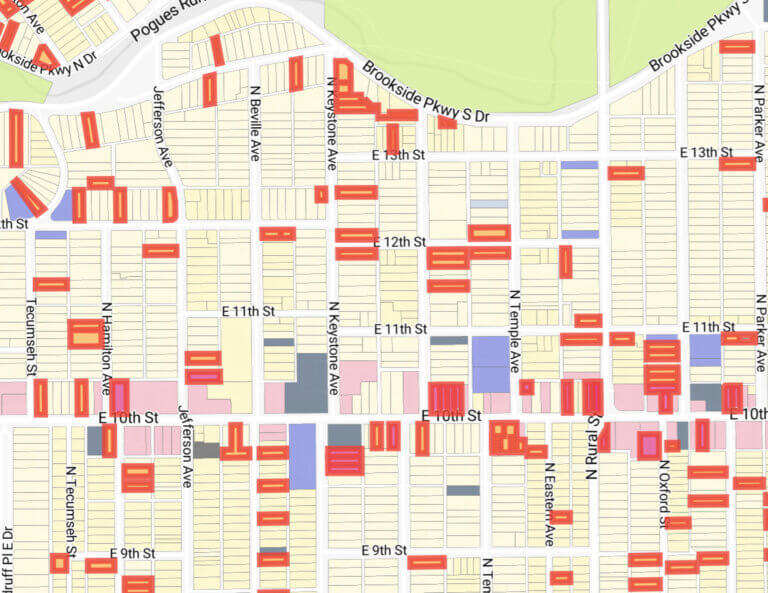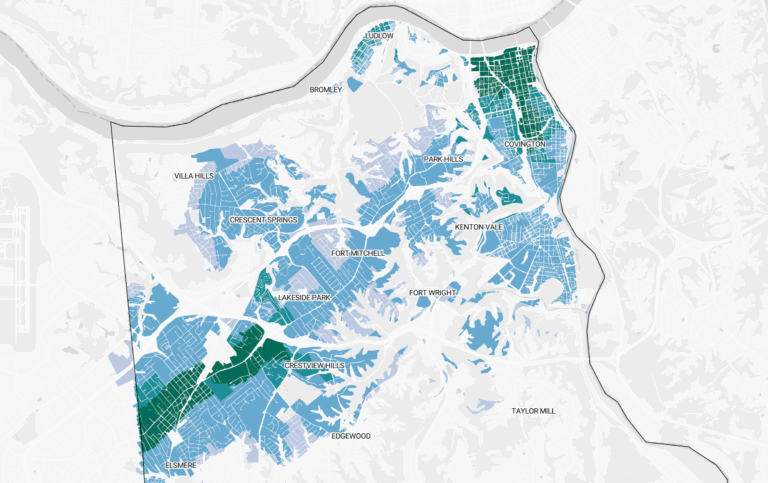
Massachusetts voters weighed in on Question 7 on November 3, 2026. The measure would bar a city or town from requiring more than 5,000 square feet of lot area and 50 feet of street frontage for a single-family home on a residentially zoned lot with public water and sewer. To test the extent of the potential impact and opportunity, we ran an analysis over every residential parcel in the state, using MassGIS parcel data, MassDEP’s water and sewer service areas, and excluded existing multifamily.
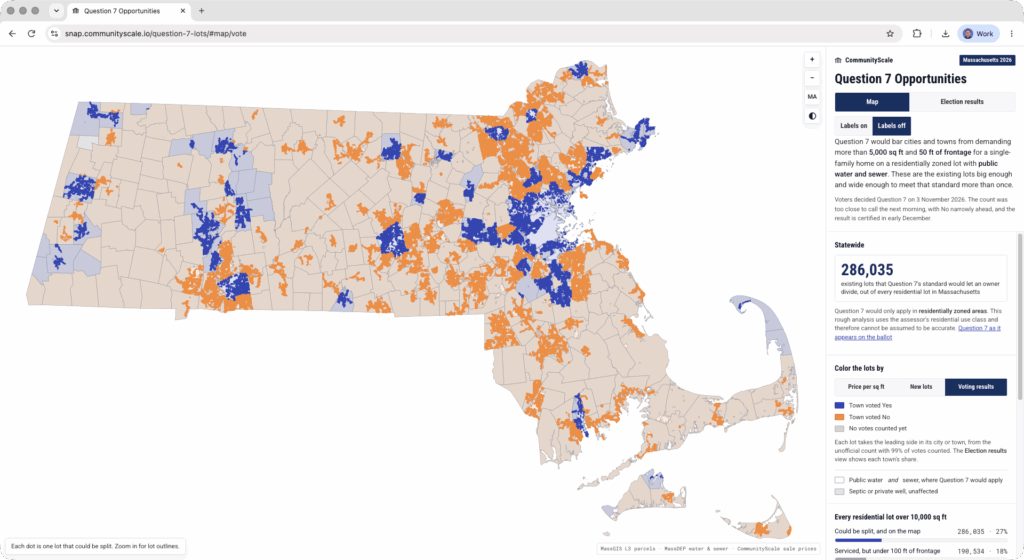
Of the 1,057,136 residential lots of at least 10,000 square feet that hold at most one home, 476,569 sit inside both a public water and a public sewer service area. Of those, 286,035 are large enough and wide enough to divide into at least two lots. For frontage, of the serviced lots big enough to divide, 190,534 are less than 100 feet wide, and a lot that narrow can yield at most one additional lot under the 50 foot rule.
The largest rate of new capacity would be in Chelmsford, which has 11,203 potential lots, or 758.5 for every 1,000 homes. Billerica follows with 9,434 and Tewksbury with 7,959. Methuen, Lexington, and Framingham each have more than 6,000.
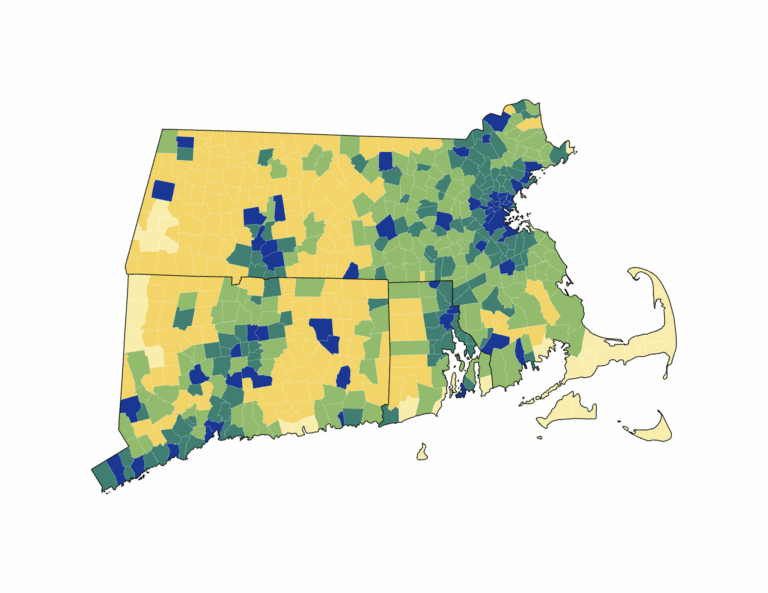
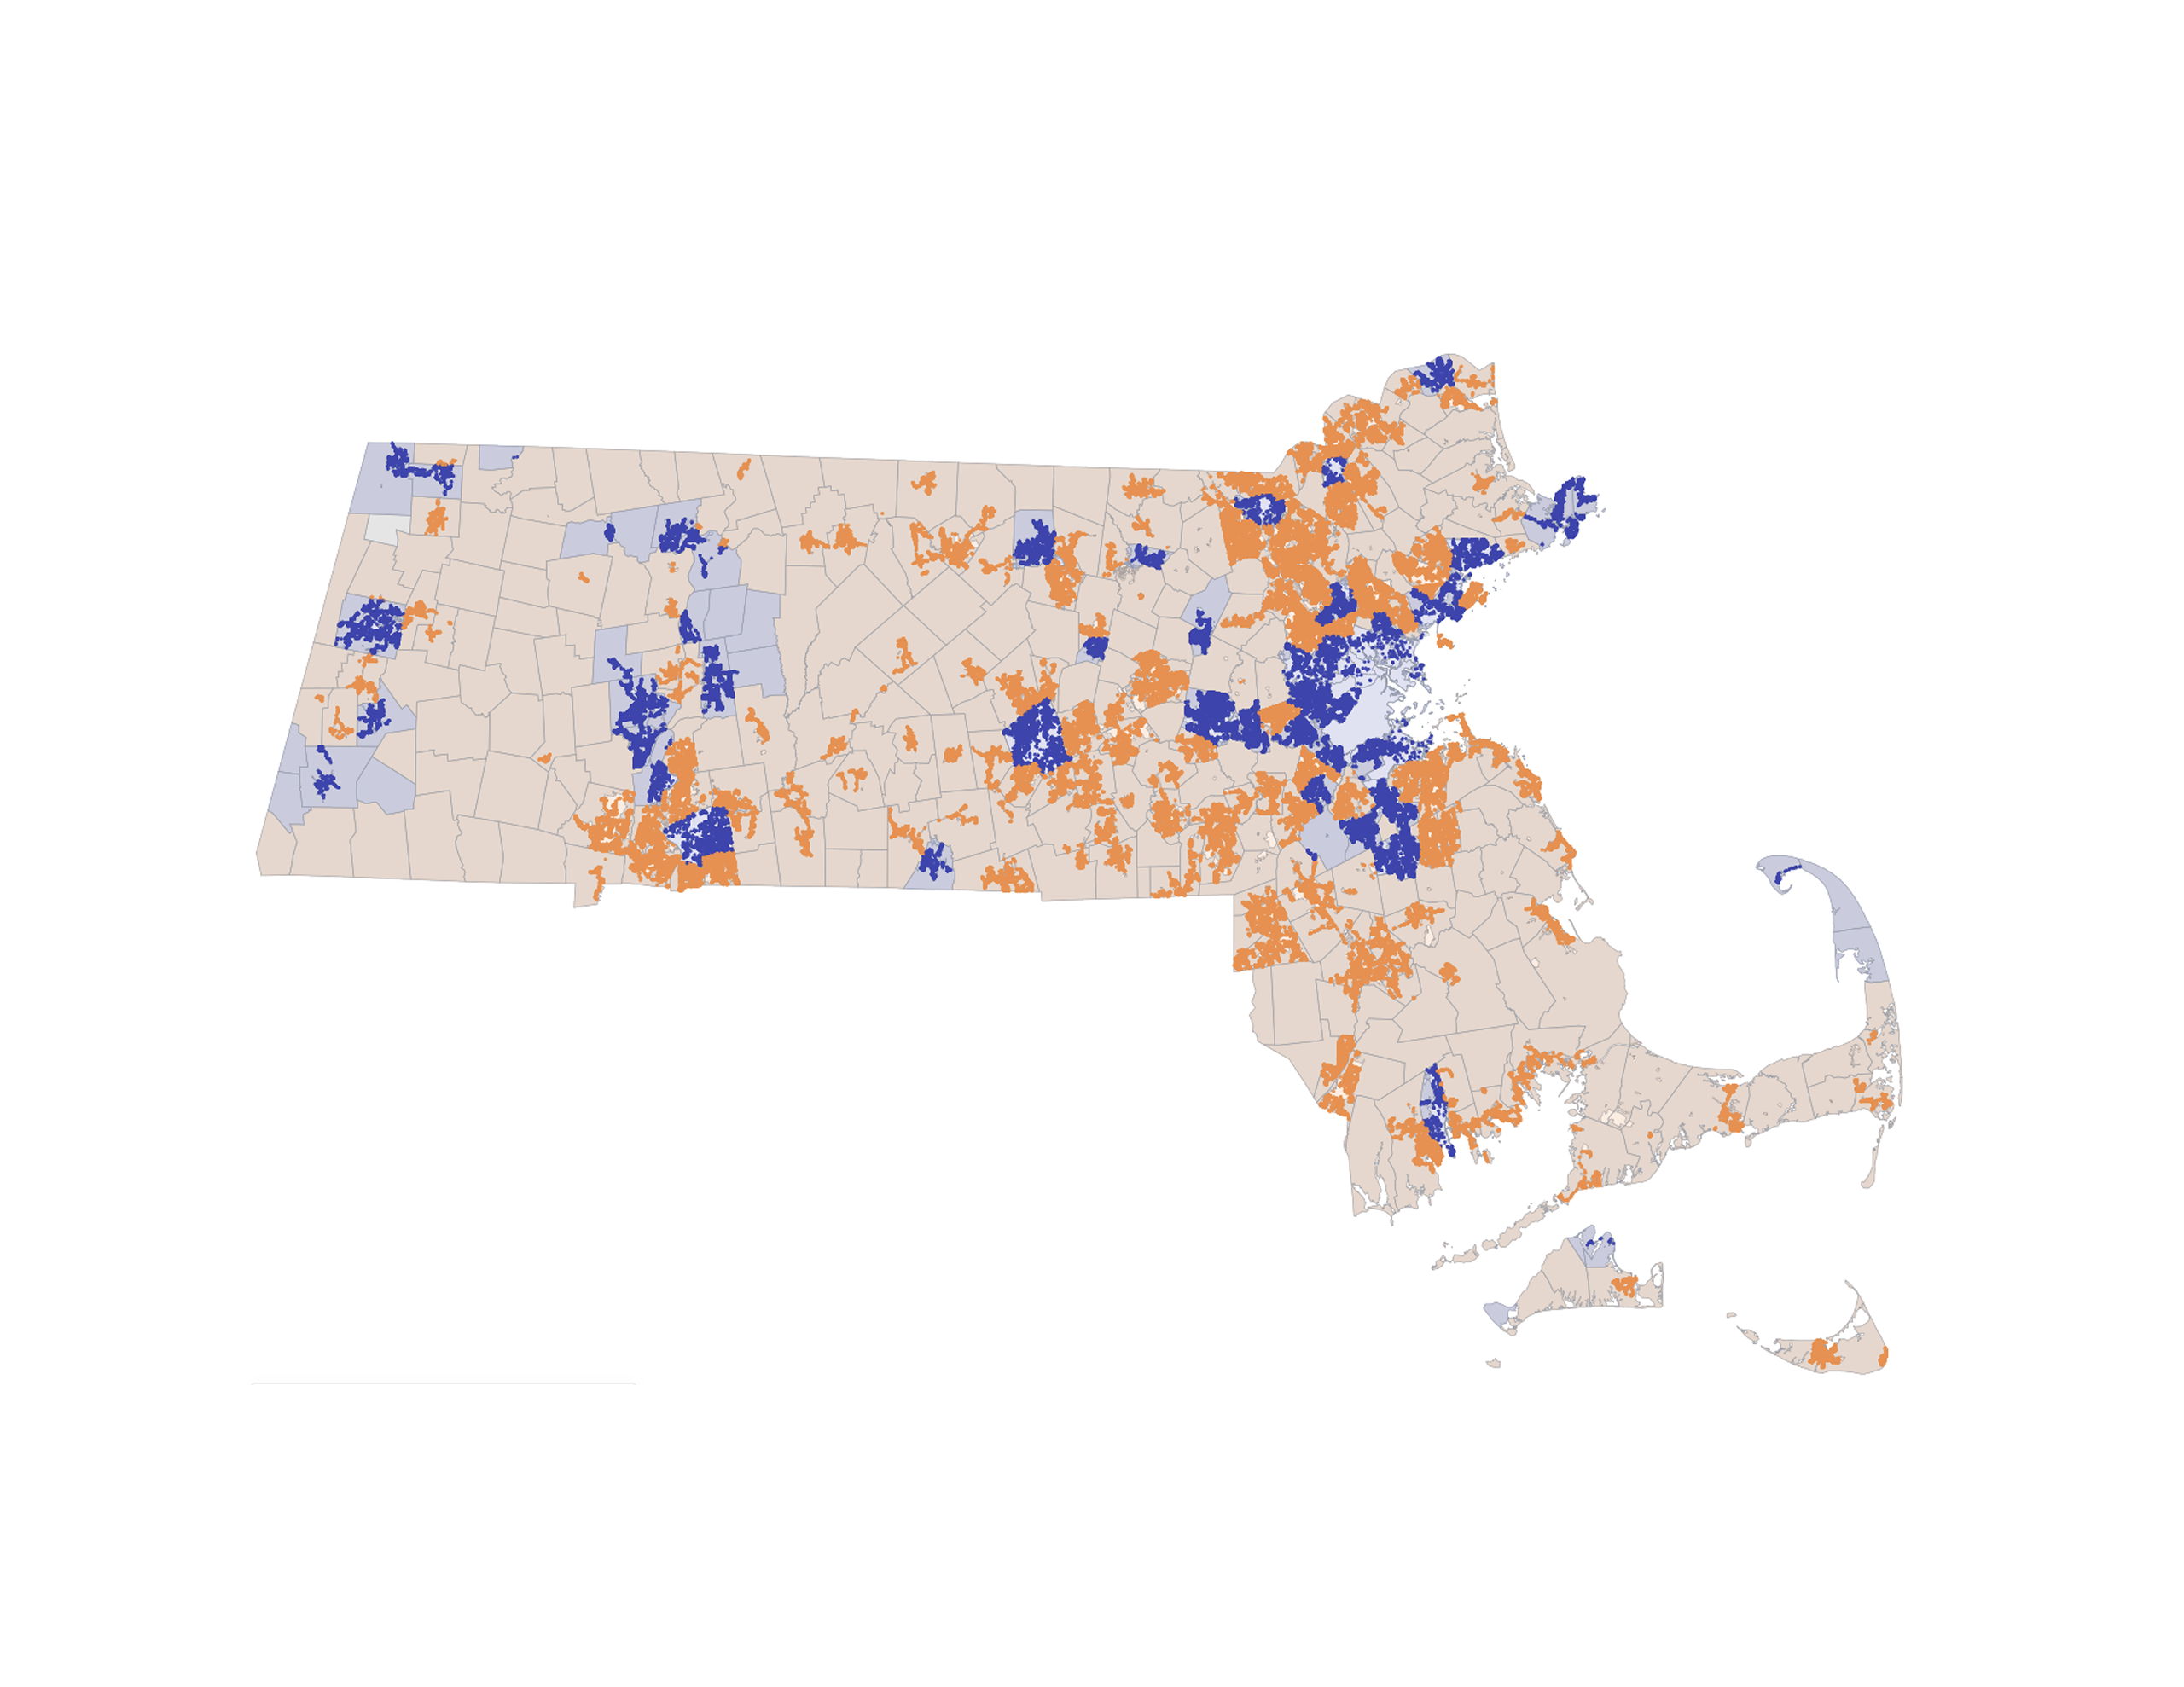
How the towns voted
The Associated Press’s unofficial count, with 99% of votes counted, had the No side ahead statewide, 50.6% to 49.4%. That is a margin of about 33,000 votes out of roughly 2.5 million cast. These figures are unofficial and can still change.
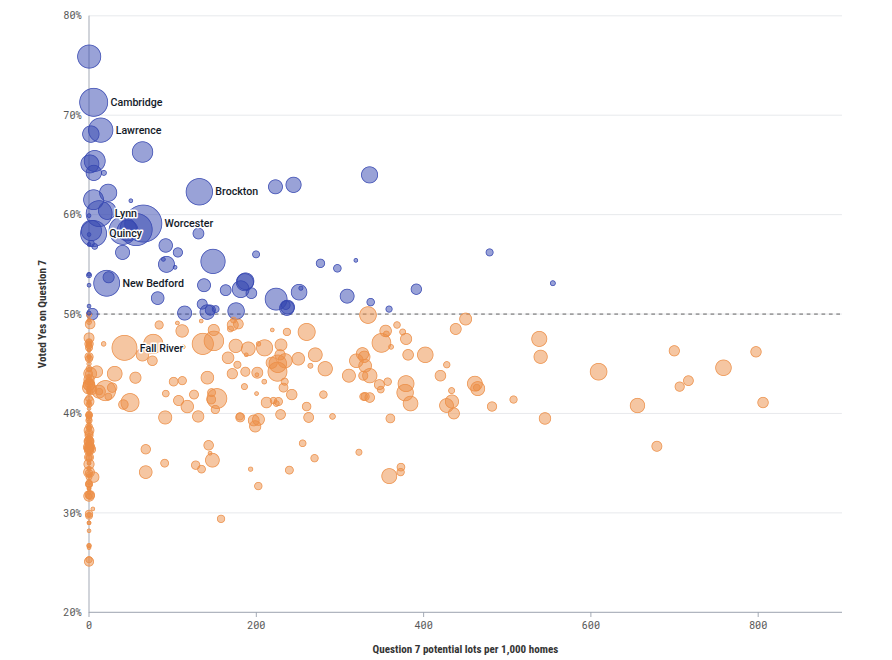
We matched the zoning and lot analysis results together. Yes support fell as capacity per home rose, though not sharply. In towns with under 100 potential lots per 1,000 homes, Yes received 49.9% of the votes cast. The share fell to 47.5% in towns with at least 100 but under 300, to 44.6% in towns with at least 300 but under 500, and to 43.6% in the 14 towns at 500 or more.
Where a Yes vote meets the most capacity
Some towns combine both measures, a Yes majority and a large number of potential lots. We ranked the 74 towns where Yes led on two measures: the Yes margin, weighted 70%, and potential lots, weighted 30%. Each measure was turned into a percentile among those towns. We then kept only towns with at least 500 potential lots, since a town with few lots has little to gain from the measure.
| Town | Yes share | Yes margin (points) | Potential lots | Lots per 1,000 homes |
|---|---|---|---|---|
| Brookline | 66.3% | 32.5 | 1,790 | 64.0 |
| Amherst | 64.0% | 28.0 | 3,605 | 335.4 |
| Brockton | 62.3% | 24.7 | 4,919 | 131.9 |
| Randolph | 63.0% | 26.0 | 3,154 | 244.5 |
| Northampton | 62.8% | 25.6 | 3,046 | 222.9 |
| Worcester | 59.1% | 18.3 | 5,467 | 64.9 |
| Springfield | 58.5% | 16.9 | 3,534 | 56.3 |
Of the seven, Amherst has the most potential lots per 1,000 homes, at 335.4. Worcester has the most lots, at 5,467, and Brookline has the widest Yes margin, at 32.5 points, on 1,790 lots.
As an example, this table gives the minimum lot area and frontage for a single-family home in Amherst’s and Worcester’s lowest-density residence zone in the current zoning bylaw, which may have evidence for popular support to decrease to 5,000 square feet minimum lot area in areas that are served by water and sewer.
| Town | Lowest-density residence zone | Current minimum lot area (square feet) | Current minimum frontage (feet) |
|---|---|---|---|
| Amherst | R-LD, Low Density Residence | 80,000 | 200 |
| Worcester | RS-10, Residence, Single Family | 10,000 | 80 |
The Question 7 map shows every qualifying lot, and its election view plots the town results at https://snap.communityscale.io/question-7-lots/#election.
Sources: MassGIS Level 3 Standardized Assessors’ Parcels (FY2025), MassDEP Estimated Public Water System and Sewer System Service Area Boundaries, MassGIS Base Streets, MHP Residensity parcel unit counts, and Associated Press unofficial results for the November 3, 2026 election.