Like many planners and geospatial professionals, the CommunityScale team was curious about an alternative to Esri’s ArcOnline platform. While Esri offers a full suite of products that make it easy to publish analysis, some clients worried about the lagging performance of embedded maps, the cost of storing basic shapefiles, and taking on deliverables tied to recurring subscription costs. Hit by a wave of creativity, curiosity, and the need for flexibility for clients outside the Esri ecosystem, it was time to rethink our baseline approach to visualizing spatial data.
While the shapefile is, perhaps, the most common data format in mapping, it is not precious. Ready to explore the limits of hosting spatial data on Github and Mapbox’s free tier, we decided to see what it would take to create our own interactive maps. Over the past few months, I was able to recreate the core functionality of Esri’s online mapping platform as an open source project. CommunityScale now uses this platform for sharing our works-in-progress and final deliverables for housing and zoning work.
Product design and development is an iterative process of refinement as we catalogue what’s working, what’s not, and what we still desire in an ideal mapping product. While we haven’t officially broken up with Esri–and are unlikely to do so with respect to market conditions– we’re excited about the possibilities in expanding our open source mapping.
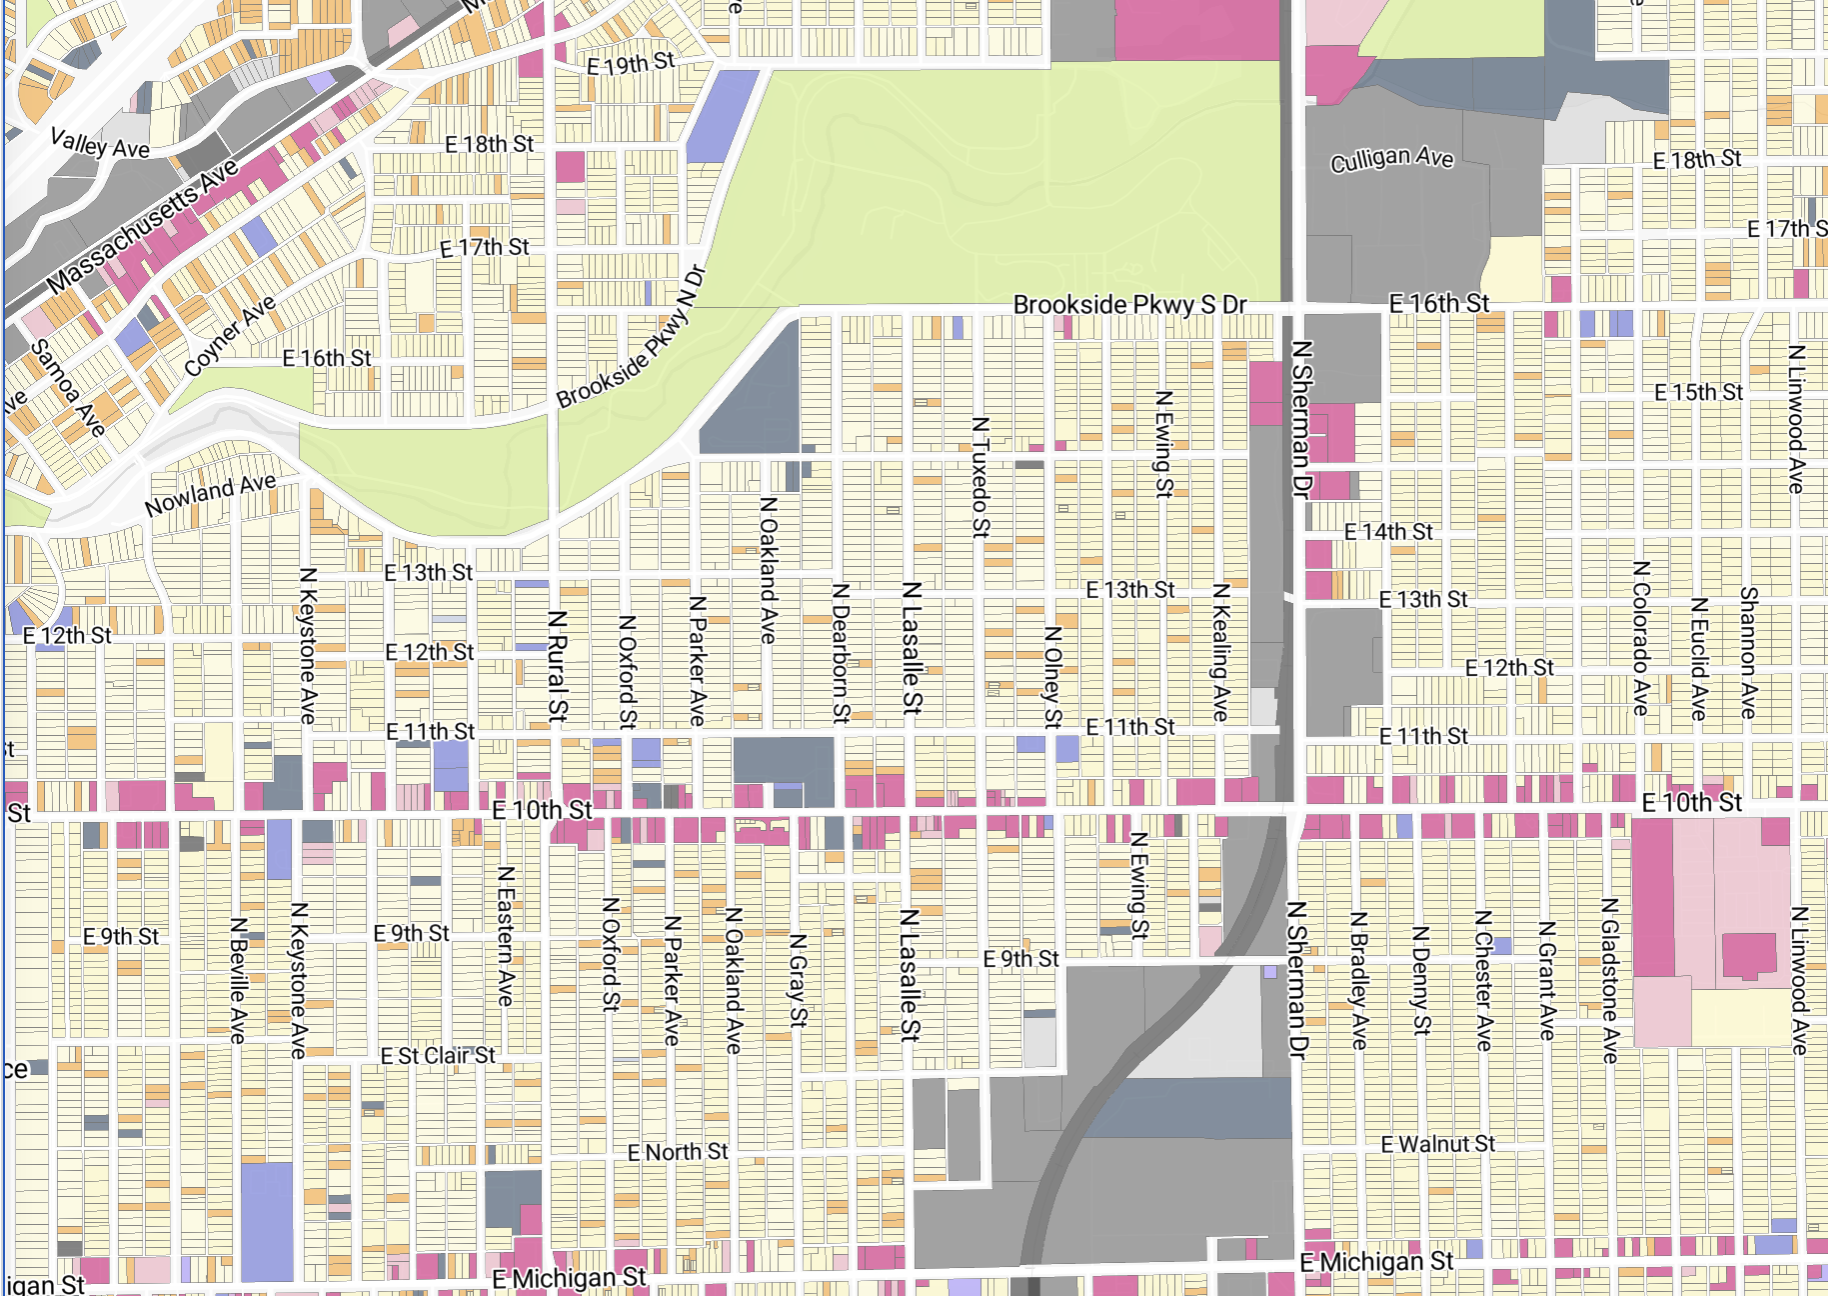
Explore Johnson County’s household and housing data on the map.
How it works
Our interactive mapping solution is straightforward. Instead of relying on expensive proprietary software, we’ve built a web-based mapping platform from widely available, open-source technologies. Here’s what’s under the hood:
Data storage with GeoJSON
We still interface with shapefiles, but our outputs for visualization are stored as GeoJSONs. A GeoJSON file can contain thousands of parcels, zoning boundaries, or infrastructure data points without the numerous sidecar files or Esri’s cloud storage costs. And since a GeoJSON is just a text file, we can easily store them on Github.
Hosting with GitHub
GitHub, best known as a platform where developers share code, also lets us host our map files for free. When someone visits our map, their browser is served the GeoJSON files directly from GitHub. This means zero hosting costs for even large datasets –our Kenton County map includes parcel, infrastructure, and demographic datasets, all hosted and served for free.
Interactive mapping with Mapbox
To display these files as an interactive map, we use Mapbox GL JS, a free JavaScript library that runs entirely in the web browser. Mapbox provides beautiful base maps (satellite imagery, street maps) under a generous free tier that covers all our current needs. The most exciting part of the process happens when Mapbox reads our GeoJSON files and renders them as interactive map layers. Users can click on parcels to view details, toggle overlays, and pan around smoothly.
Professional interface with Tailwind CSS
Our map interface uses Tailwind CSS, a modern styling framework that makes it easy to create clean controls and an intuitive user interface. The sidebar with toggles, legends, and descriptions you see on our maps? That’s all Tailwind polishing the HTML structure.
Putting it all together
The final output is a single HTML file (~75KB) that contains all the code needed to create a functional interactive map. When someone visits the map:
- Their browser loads the HTML page
- Mapbox renders the base map
- The GeoJSON files are served from GitHub
- JavaScript code renders the interactive layers, showing everything from development suitability to cost burden
- Tailwind CSS styles make everything look professional
The map product runs entirely in the browser. No servers to maintain and, as quite the cherry on top, no recurring costs. We can embed these maps in our reports, share them with clients, or publish them to the web. When we need to update data, all we have to do is replace the GeoJSON file on Github.
Why this matters for planning work
For housing and zoning analysis, this open source mapping enables us to:
- Layer multiple datasets – parcels, zoning, infrastructure, demographics, property values – all visible and toggleable
- Share work-in-progress with stakeholders who can interact with the map in real-time
- Deliver sustainable final products to clients without locking them into expensive subscriptions
- Update analyses by simply swapping out data files
- Customize everything – since we control the code, we can add any features we need
This Kenton County map is a great example: it displays suitability scores for thousands of parcels, allows users to toggle 15+ different overlay layers, and provides detailed information on click –all running from an HTML file and some GeoJSONs hosted for free on GitHub (check out the repo).
